
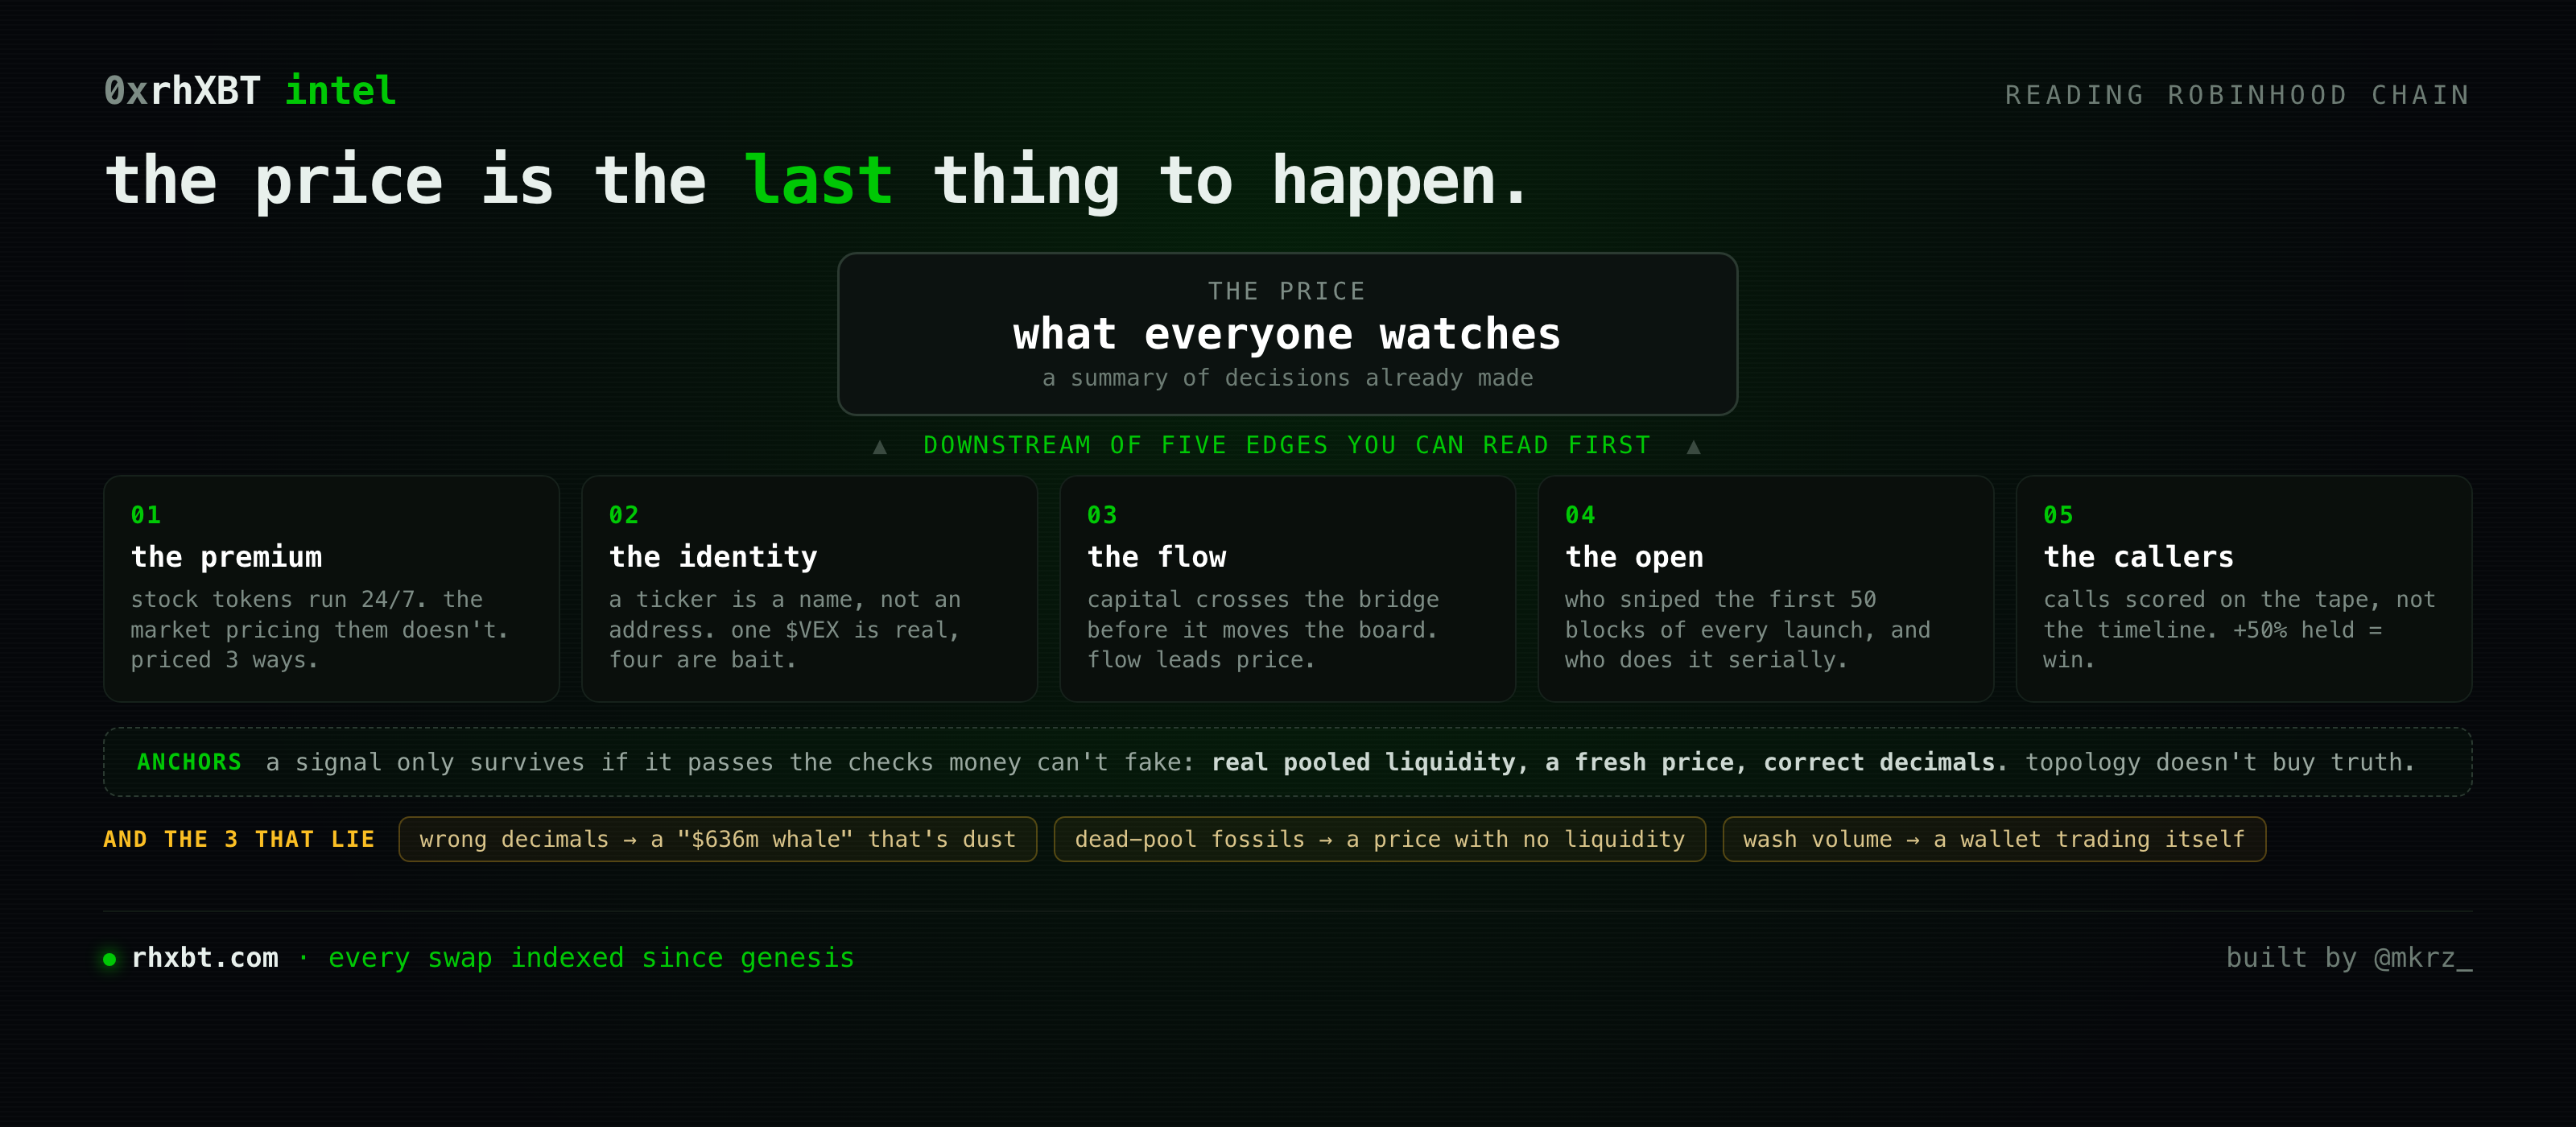
Most people look at a token on Robinhood Chain and see one number: the price. That number is the last thing to happen. Everything that decides whether you are early or exit liquidity happened before it printed, and it is all sitting onchain in public, where almost nobody bothers to read it.
This is the difference between watching a chart and reading a chain. One tells you what already happened to the price. The other tells you who it happened to, who moved first, and whether the thing you are about to buy is even the token you think it is.
By the end of this article you will understand Robinhood Chain better than almost anyone you follow: why the price is the least useful number on the screen, the five edges hiding underneath it, the exact moment onchain data starts lying to you, when none of this is worth your time, and how to read the whole thing yourself in about thirty seconds.
Before we start: the terminal is free at rhxbt.com, and there is a free Telegram bot that answers any token, wallet, or board on demand. Both links are at the bottom.
1Start with what the chain is actually for
The person who built this chain said the quiet part out loud.
Vlad Tenev · @vladtenev · Jul 17 Robinhood Chain exists to make real world assets programmable, globally portable, and always available, with the product quality you've come to expect from Robinhood.
(paste this on its own line in the X editor to embed the live post: https://x.com/vladtenev/status/2077814433762451646)
Read that again with a trader's eye. "Real world assets" means tokenized stocks. "Always available" means they trade 24/7, on a chain that never closes, next to memecoins and bridged capital in the same block.
That one design choice is the source of everything in this article. The moment a stock that never stops trading has to agree with a stock market that closes at 4pm, and a permissionless token can wear the same ticker as a real company, you get inefficiencies that cannot exist on a chain that only trades dog coins.
I started indexing every swap on Robinhood Chain since its genesis block, not to trade, but to read those inefficiencies. They are the edge. The rest of this is a tour of them.
2The price is downstream of everything
Here is the reframe that changes how you look at any token here.
A price is a summary. It is the market compressing thousands of individual decisions into one printed number, and by the time you read it, every one of those decisions is already made. The wallet that bought the open is already in profit. The bridge deposit that is about to hit already left L1. The premium already opened.
The chart shows you the summary. The chain shows you the inputs.
▸ TWO READS OF THE SAME TOKEN

  THE CHART                        THE CHAIN
  one number: the price            who bought the open, and when
  updated after the move           the bridge deposit before the move
  what already happened            the inputs still being priced
  a crowd reacting to a decision   the decision itself
If you only ever read the summary, you are always reacting to a decision someone else already made with better information. Everything below is an input the price has not finished pricing yet.
3Edge one: the stock that trades at a premium to the stock
This one exists nowhere else, because no other chain has the stocks. It is Vlad's "always available" turned into a number.
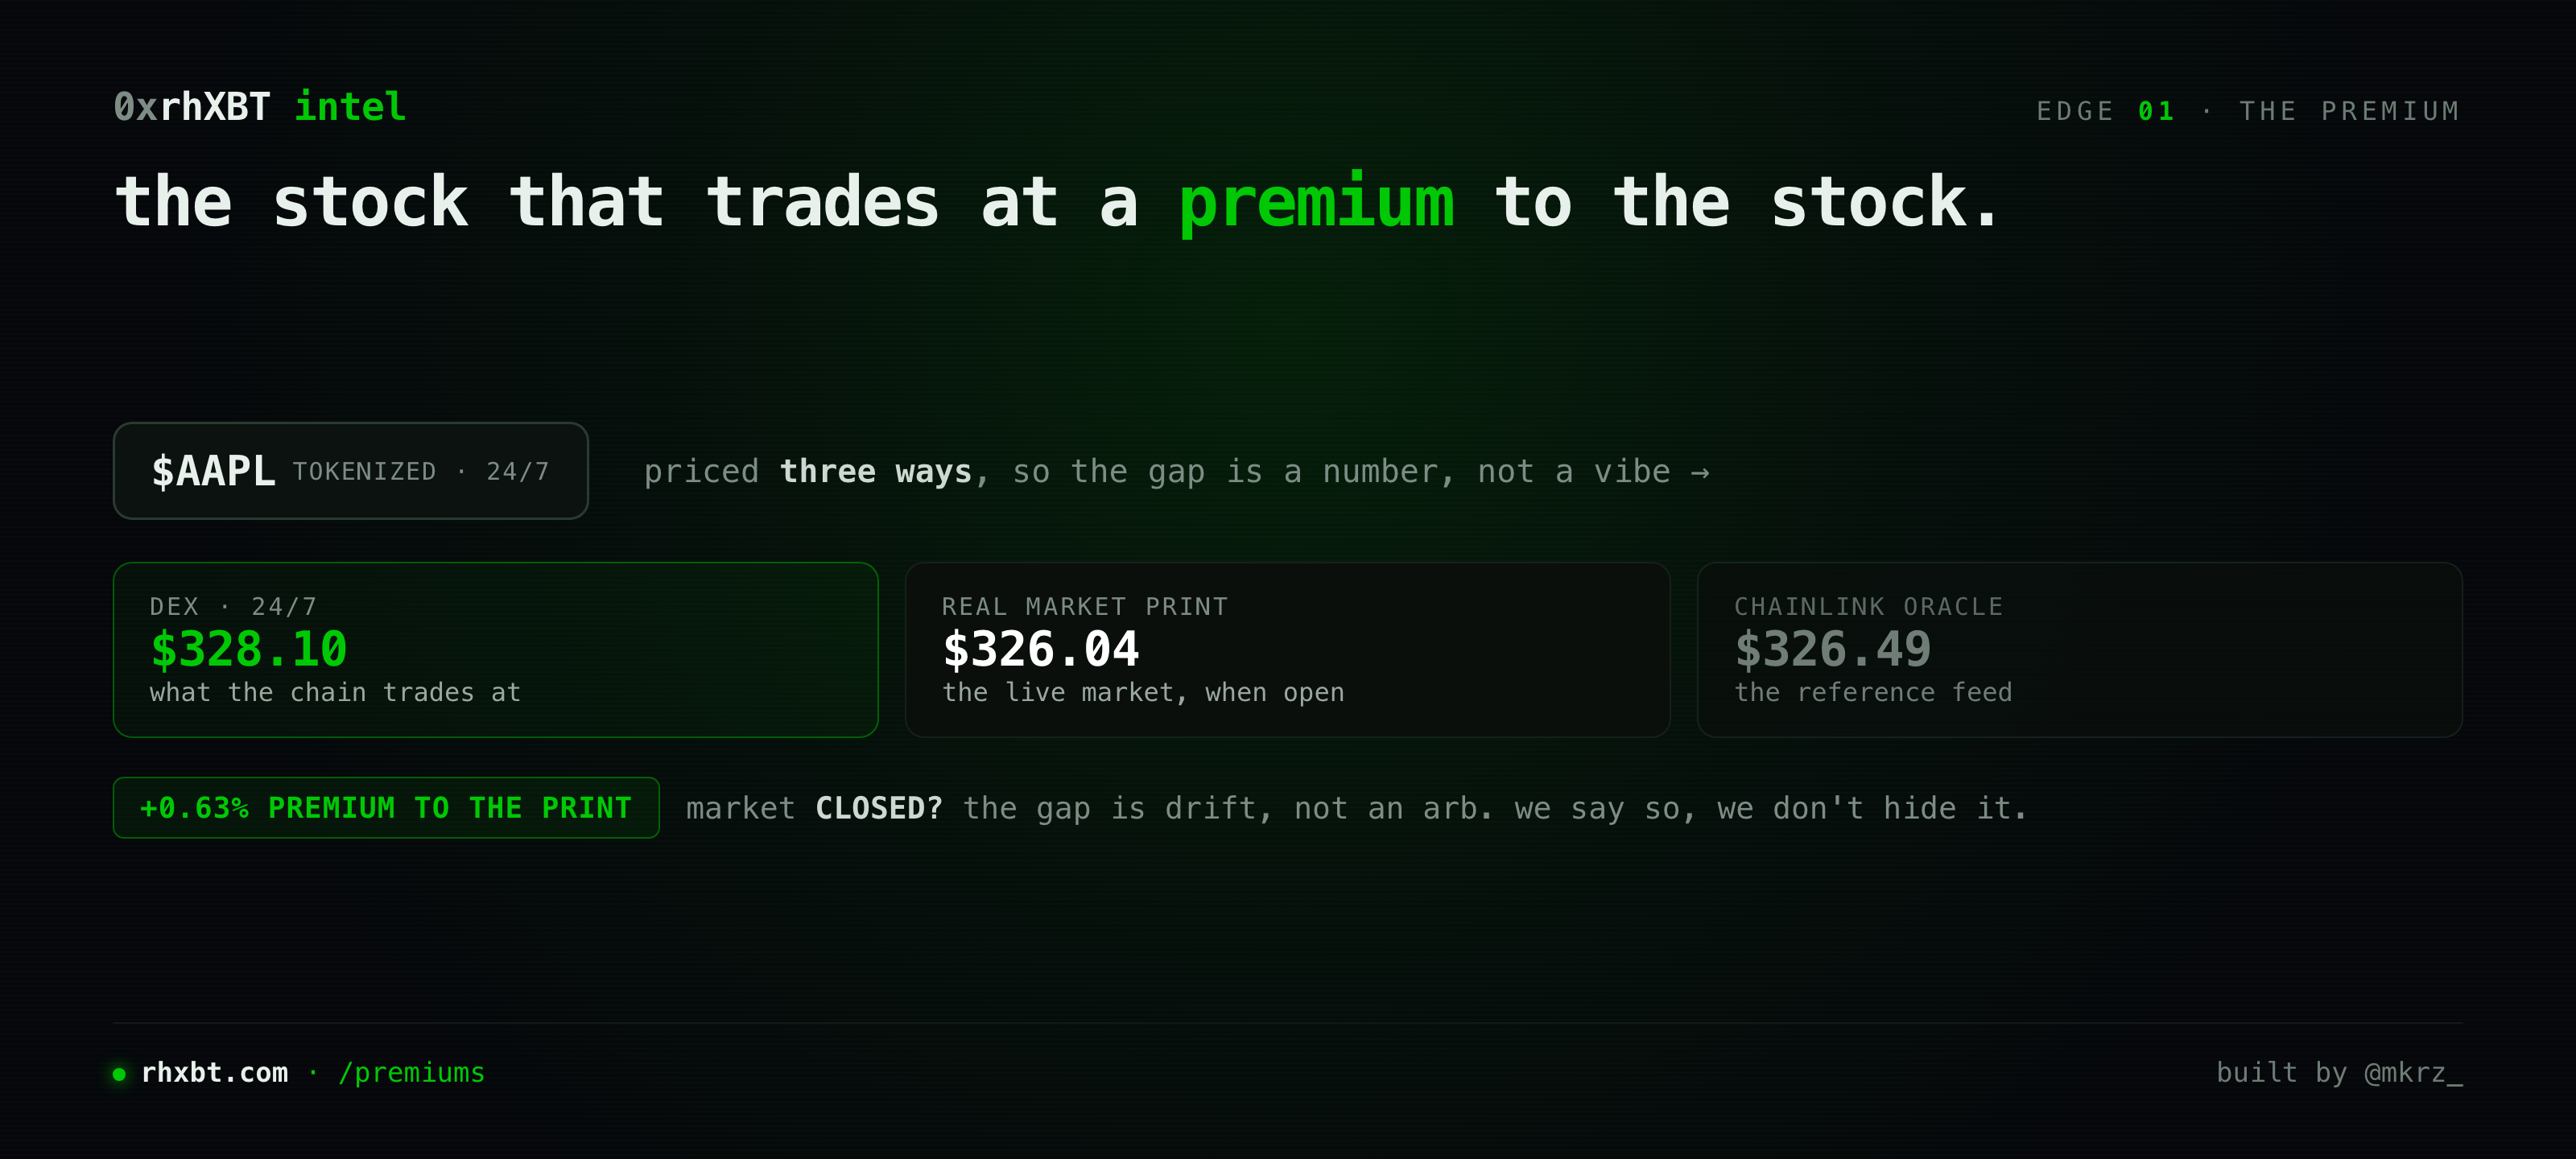
A tokenized $AAPL trades 24 hours a day, 7 days a week. The Nasdaq that prices real $AAPL is open about six and a half hours on weekdays. So for most of every week, the onchain price of a stock token is floating free of the market that is supposed to anchor it.
Most tools show you one price and call it a day. The honest way to price a stock token is three ways at once.
▸ PREMIUM READ   (example shape — a stock token, market OPEN)

  $AAPL   dex, 24/7      328.10    ← what the chain actually trades at
          real print     326.04    ← the live market, while it's open
          oracle         326.49    ← chainlink

  read    +0.63% premium to the real print   (measurable to the cent)
  CLOSED  outside market hours the gap is DRIFT, not an arb —
          there's nothing to trade against until the bell, and we say so
One price for a stock token is always hiding two others. A pure memecoin tool does not know to look for this. A tradfi tool cannot build it, because it has never seen the chain.
4Edge two: a ticker is a name, not an address
On a permissionless chain, names are free. Anyone can deploy a token and call it $VEX. So can the next person. So can the scammer.
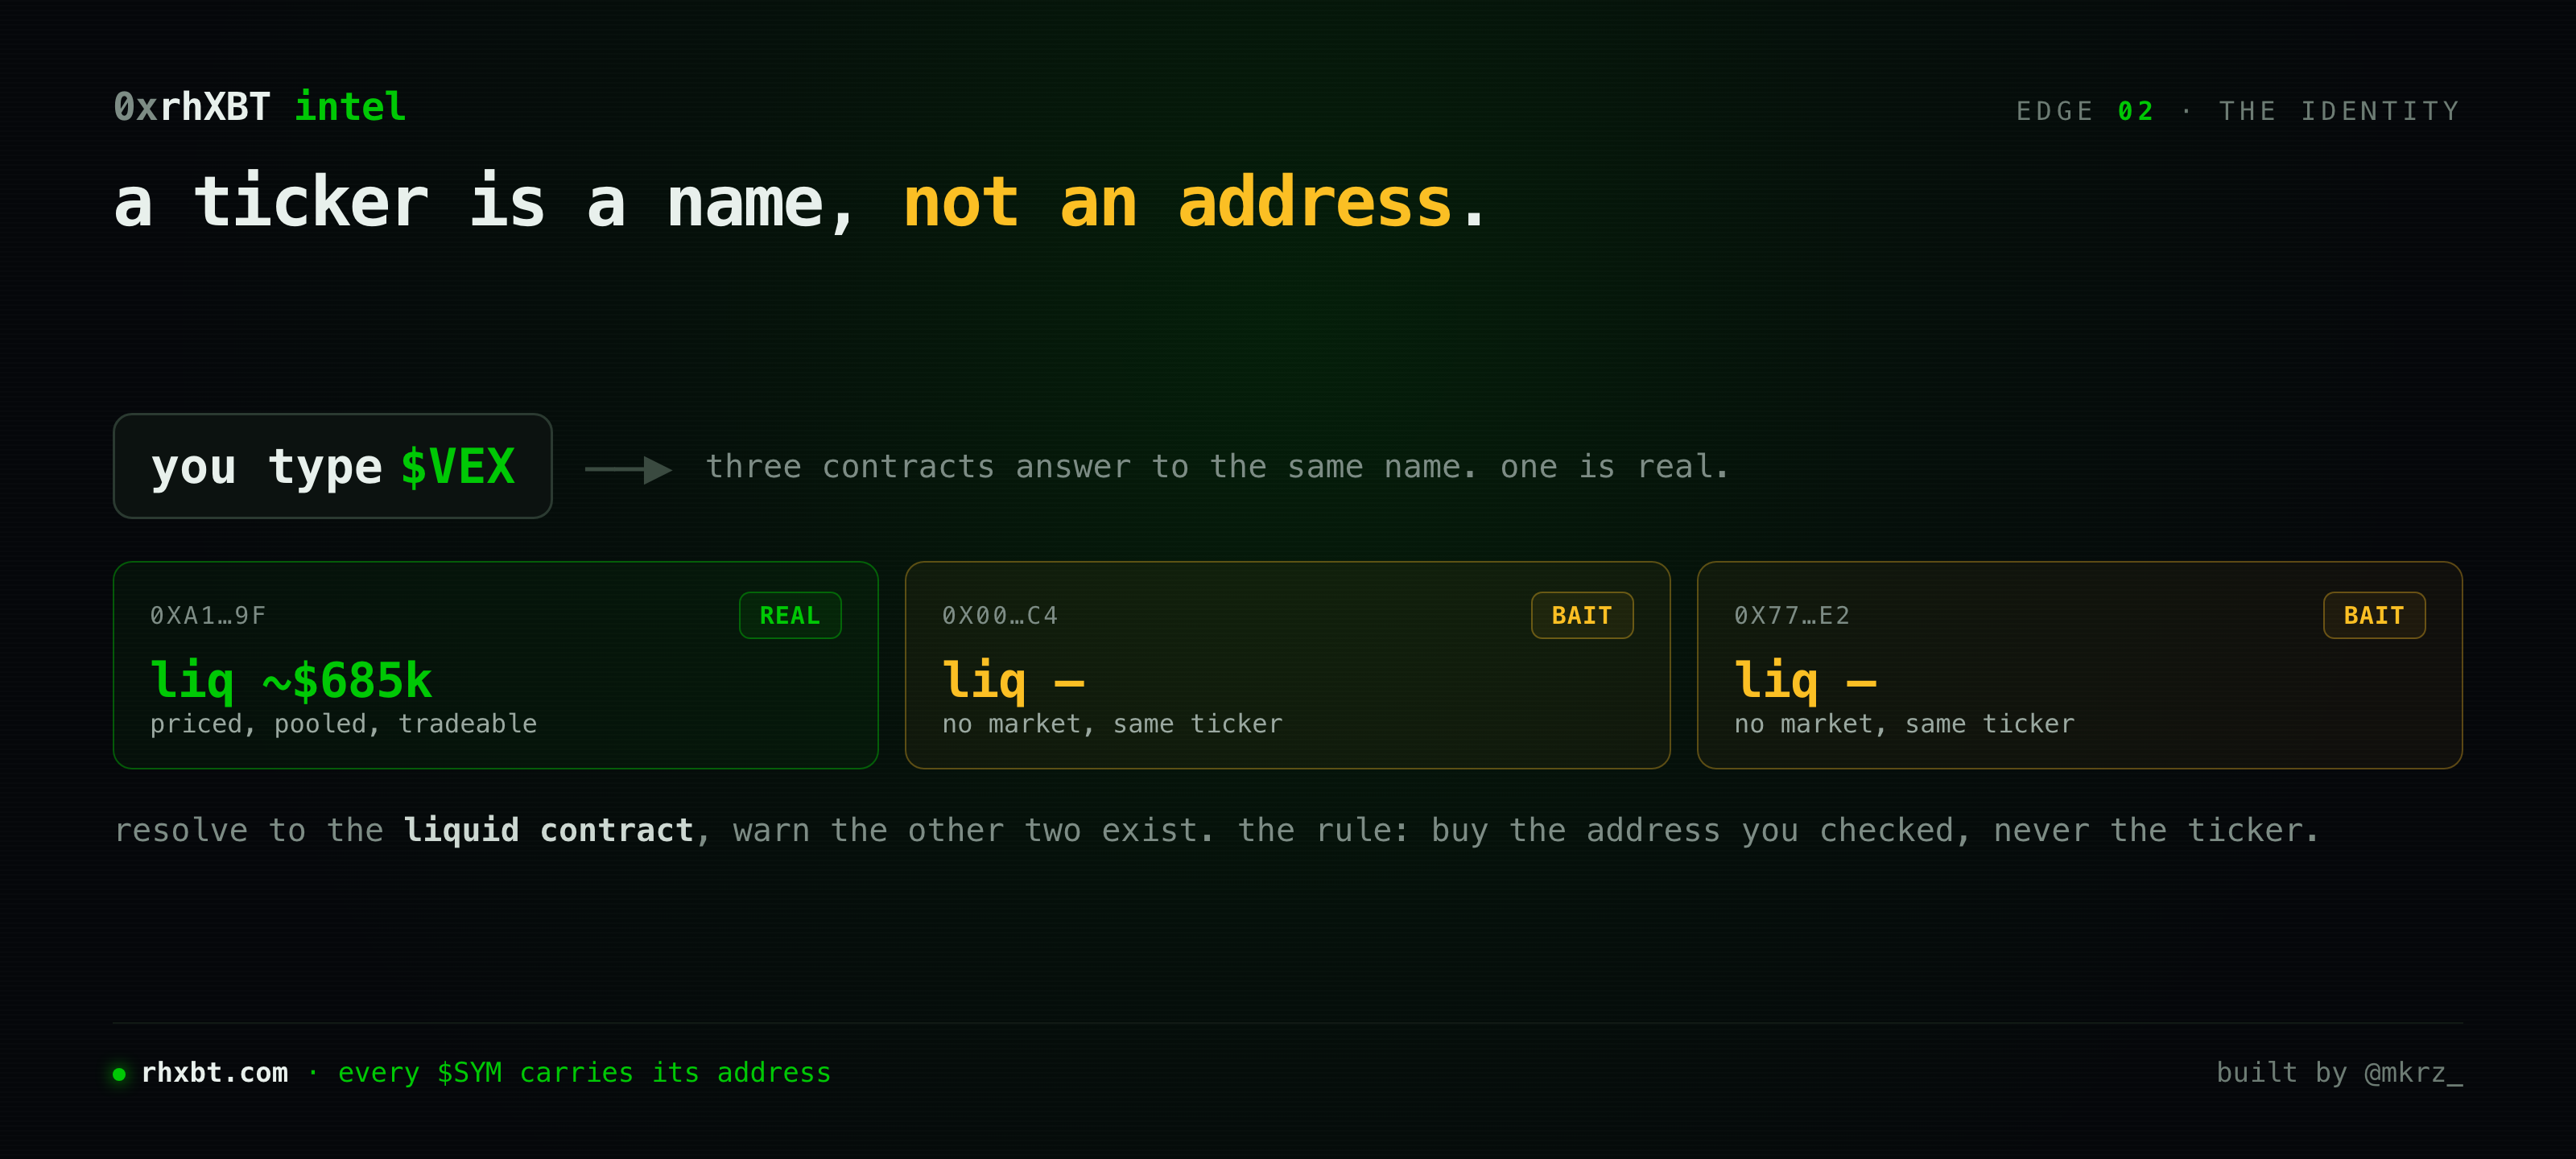
Search a hot ticker here and you will routinely find several contracts answering to the same symbol, and exactly one of them holds the liquidity. The rest are there to catch the person who typed the name, saw a match, and bought without checking the address.
▸ TICKER RESOLVE   input: "$VEX"

  on-chain   3 contracts answer to this name
  0xA1…9f    liq ~$685k    price ✓     ← the real one, resolved here
  0x00…c4    liq —         price —      impersonator, no market
  0x77…e2    liq —         price —      impersonator, no market

  result     resolve to the LIQUID contract, warn the other two exist
  rule       a name is not an address. buy the address, not the ticker.
This is the single most expensive beginner mistake on any new chain, and it is invisible if your tool resolves a ticker to "the first thing that matches." A symbol is a label. The address is the identity. A tool that treats the label as the identity is how somebody buys the impersonator.
5Edge three: capital crosses the bridge before it moves the board
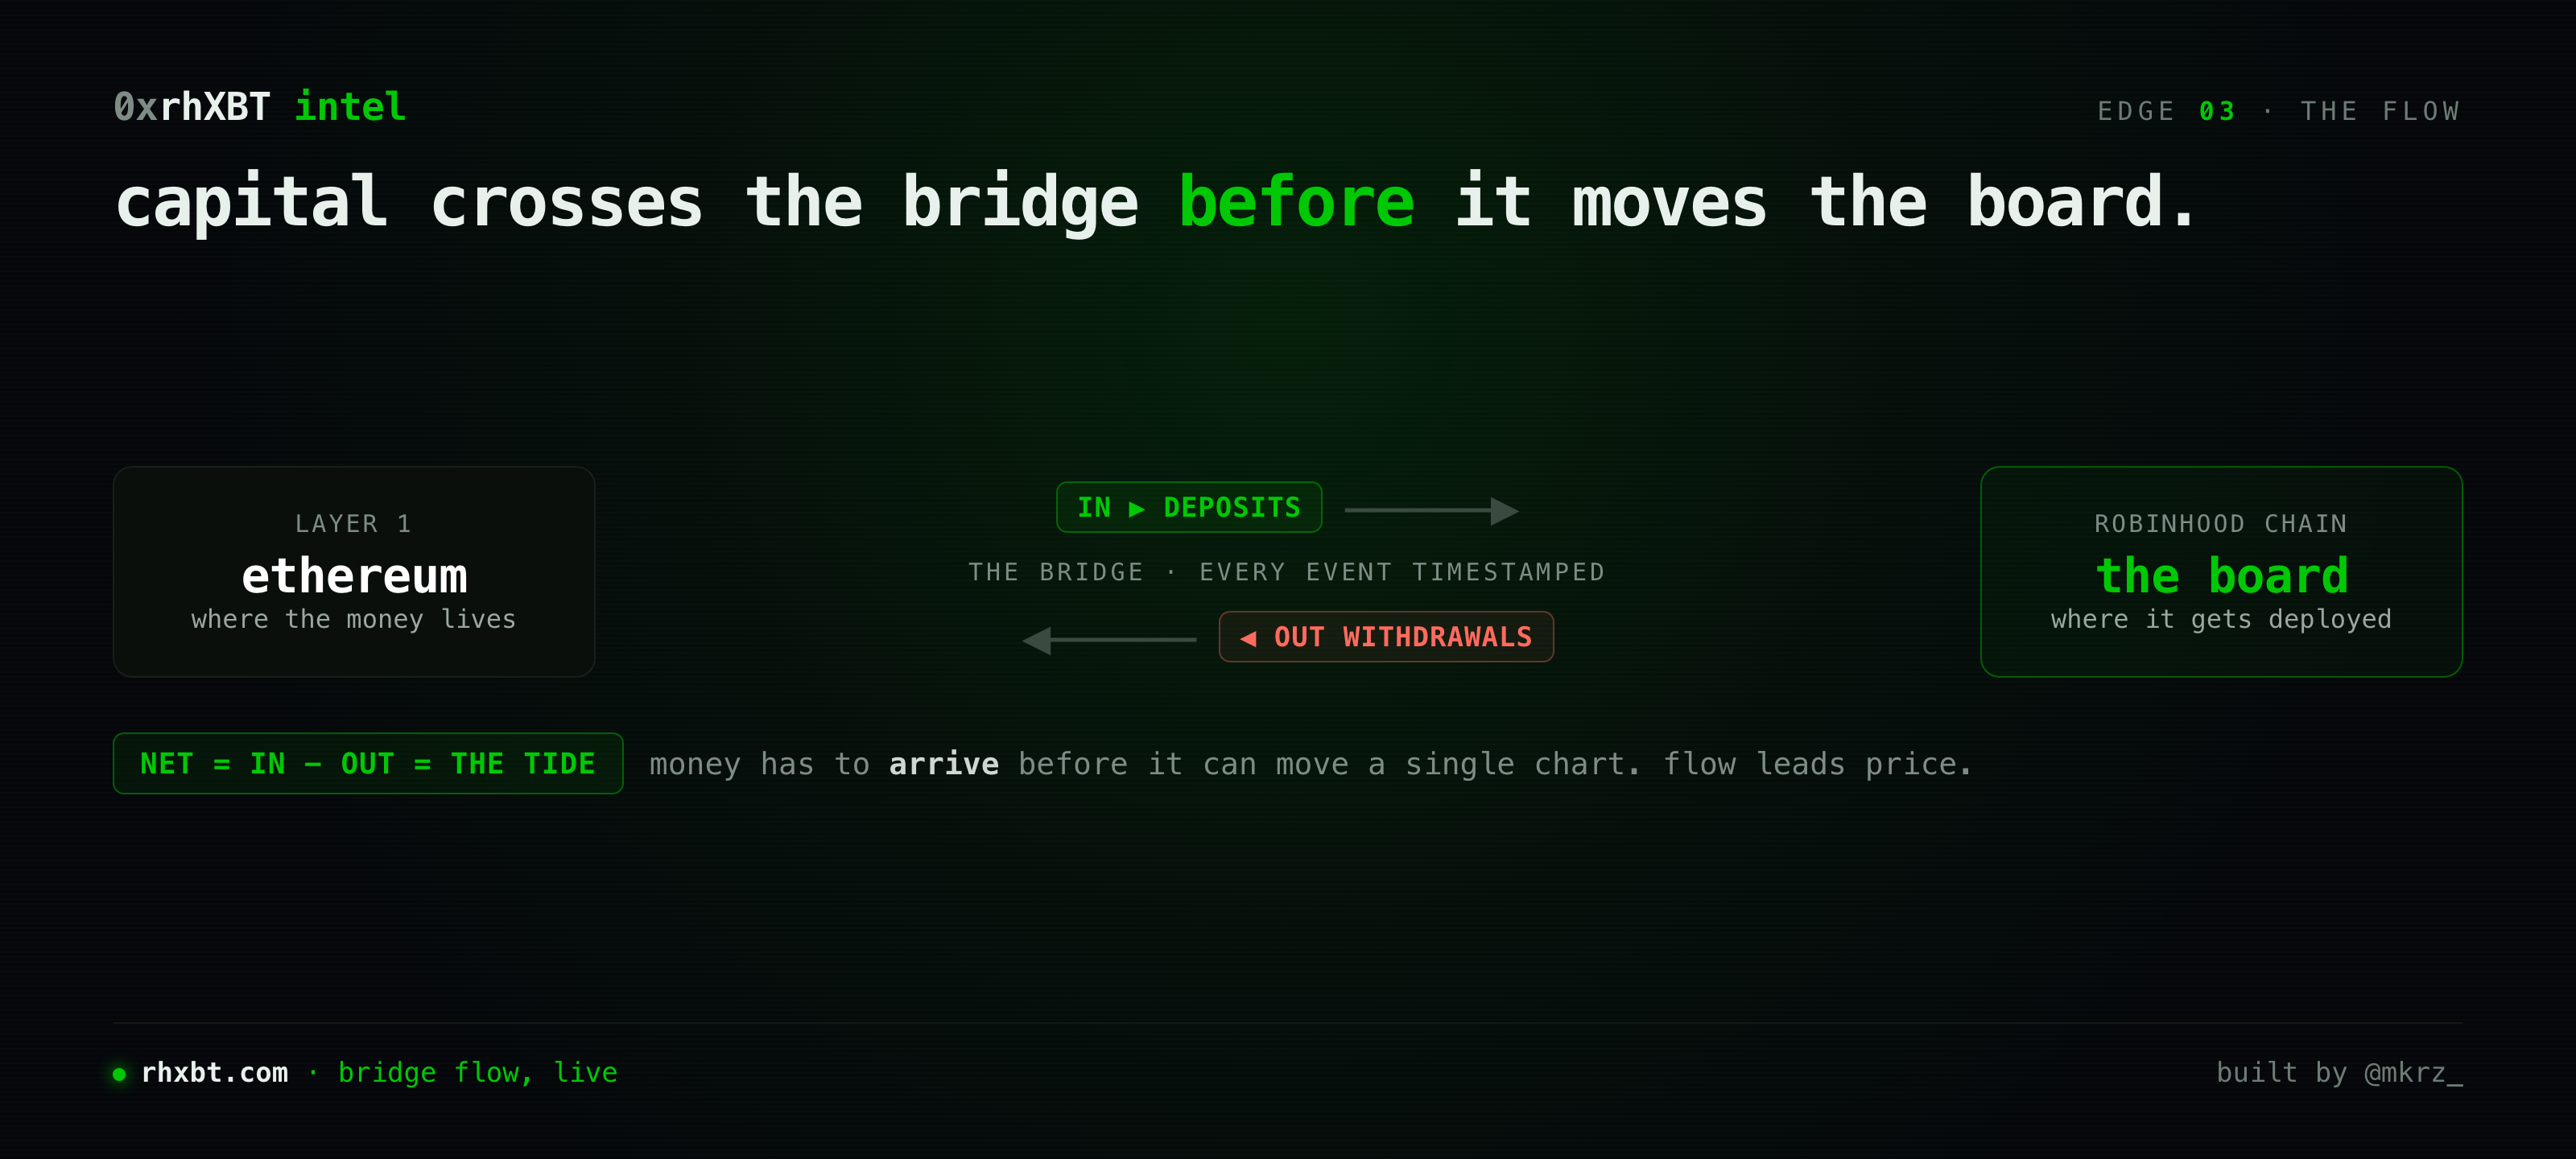
Money on Robinhood Chain does not appear from nowhere. It bridges in from L1, and every one of those deposits and withdrawals is an onchain event with a timestamp.
That means capital flow is readable before it is deployed. A large deposit lands on the chain before it is split across tokens and starts moving prices.
▸ BRIDGE FLOW   (L1 ⇄ Robinhood Chain — the read)

  IN    deposits from L1     ▲ capital arriving, timestamped per event
  OUT   withdrawals to L1    ▼ capital leaving
  NET   in − out             = the tide, before it touches a chart

  why   money has to ARRIVE before it can trade. flow leads price.
Read the bridge and you are watching the tide come in. Read the charts only and you are watching the boats rise and wondering why.
6Edge four: who sniped the first fifty blocks
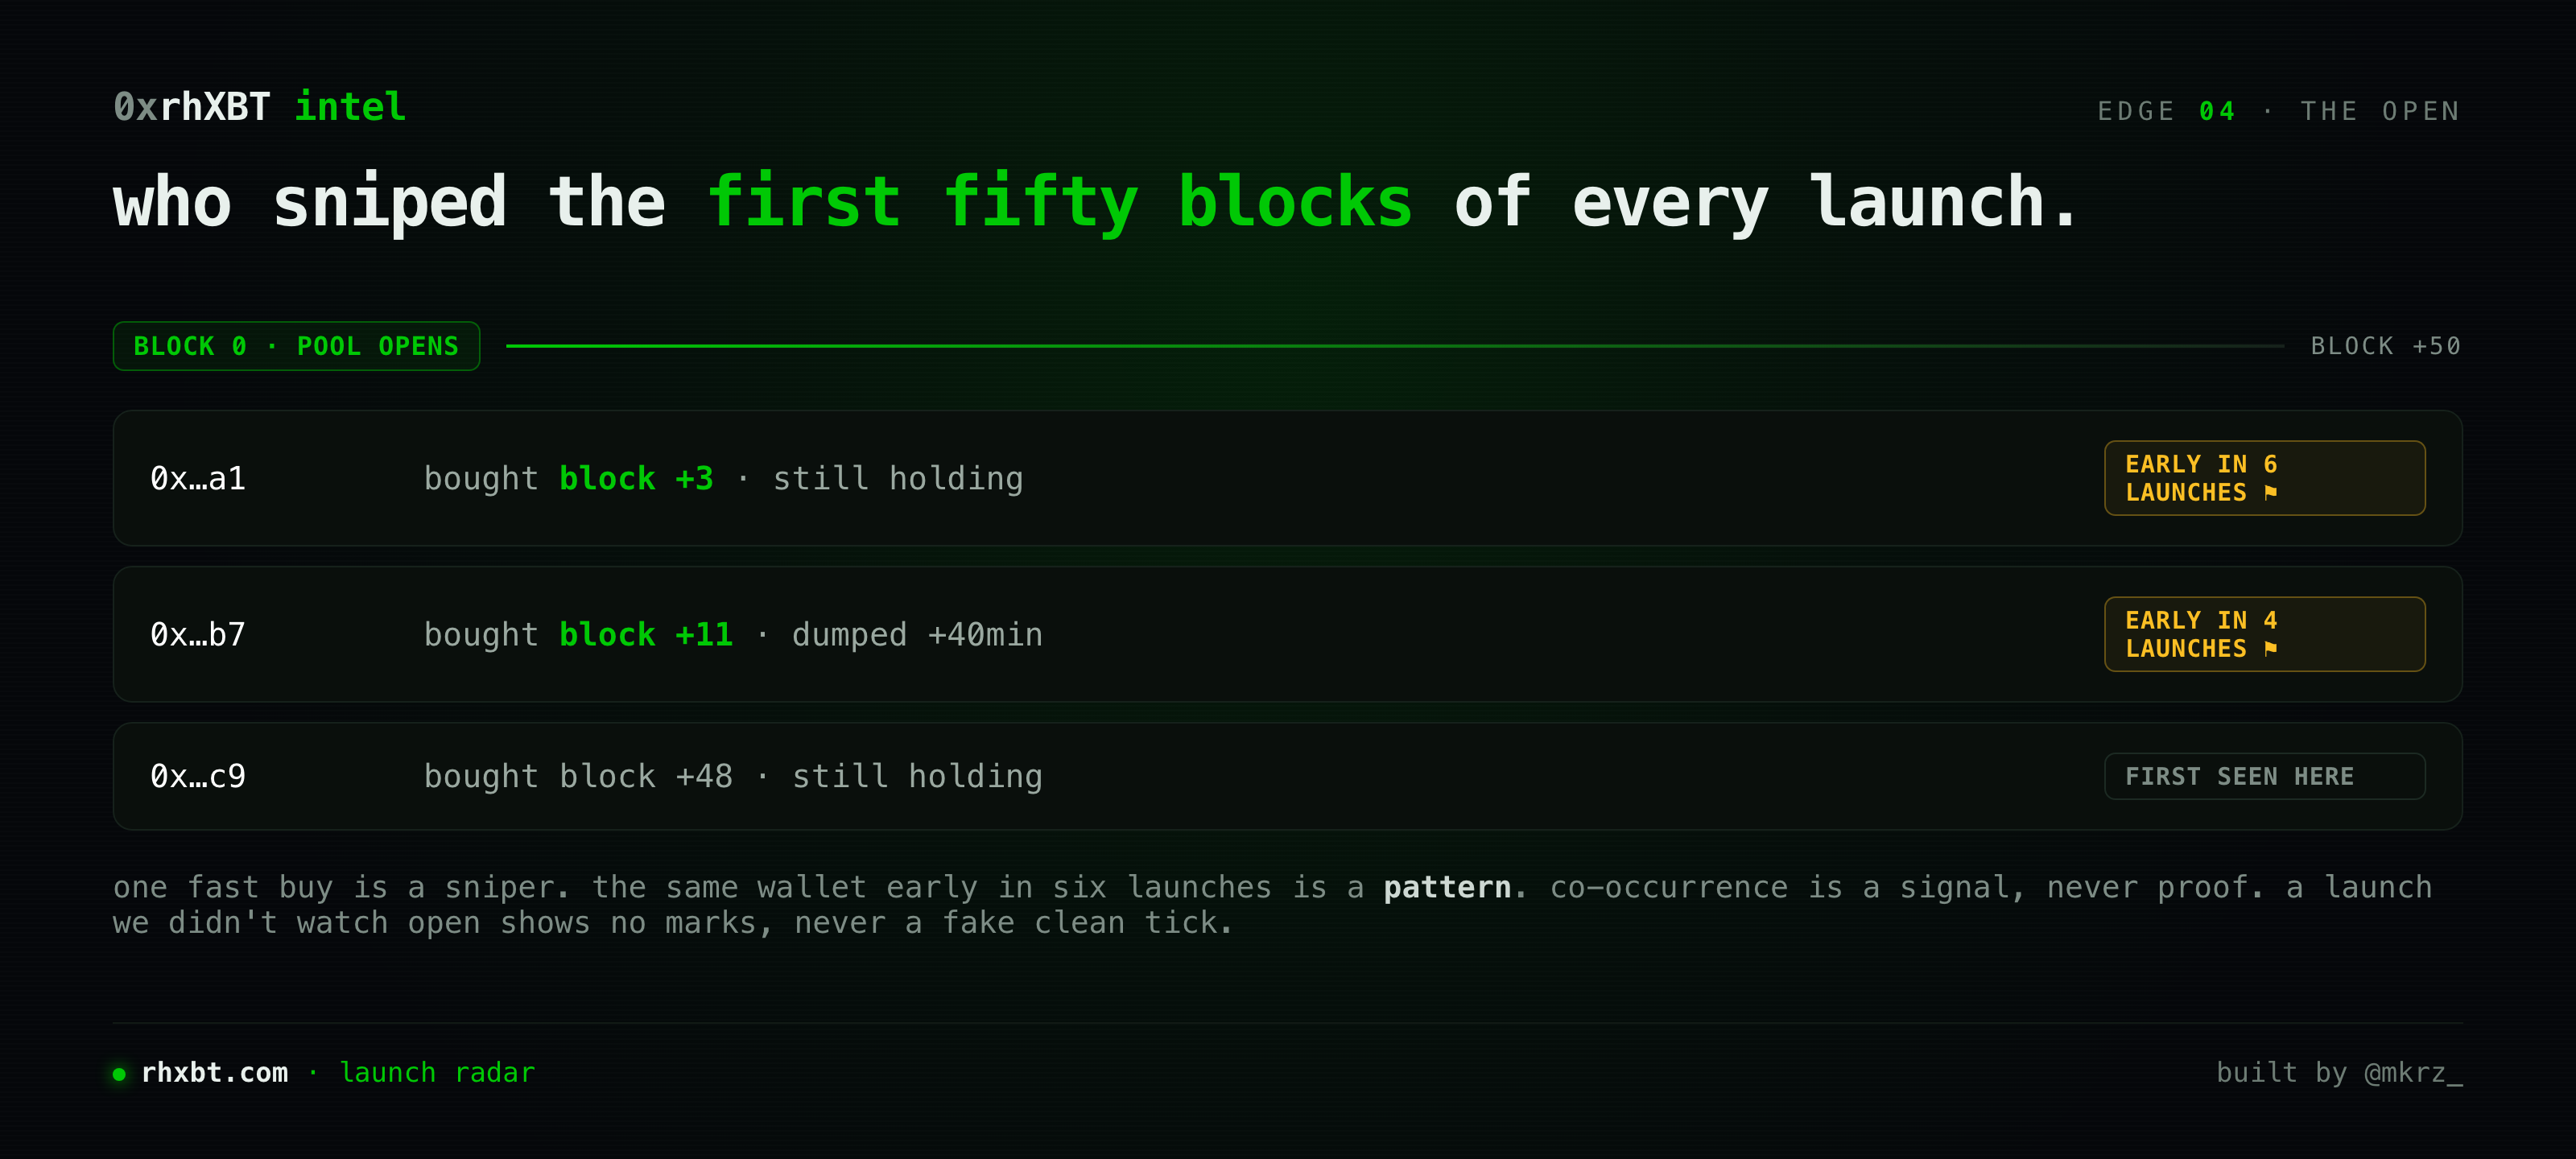
Every launch is a public record of who was early, down to the block.
When a pool opens, the wallets that buy in the first fifty blocks did not get lucky. A pool that is seconds old is not something five people independently stumble into. Index every pool since genesis and you can name those wallets, watch who still holds versus who already dumped, and see which wallets are early across many launches.
▸ SNIPER READ   pool: a fresh launch, first 50 blocks

  0x…a1   in @ block +3    still holding    early in 6 other launches ⚑
  0x…b7   in @ block +11   dumped +40min    early in 4 other launches ⚑
  0x…c9   in @ block +48   still holding    first seen here

  read    serial-early wallets flagged. co-occurrence is a signal, not proof.
  absent  a launch we didn't watch open shows NO marks — never a fake ✓
One fast buy is a sniper. The same wallet early in six launches is a pattern, and the pattern is not luck. It is a fact worth knowing before you decide a launch is organic.
7Edge five: which callers actually call winners
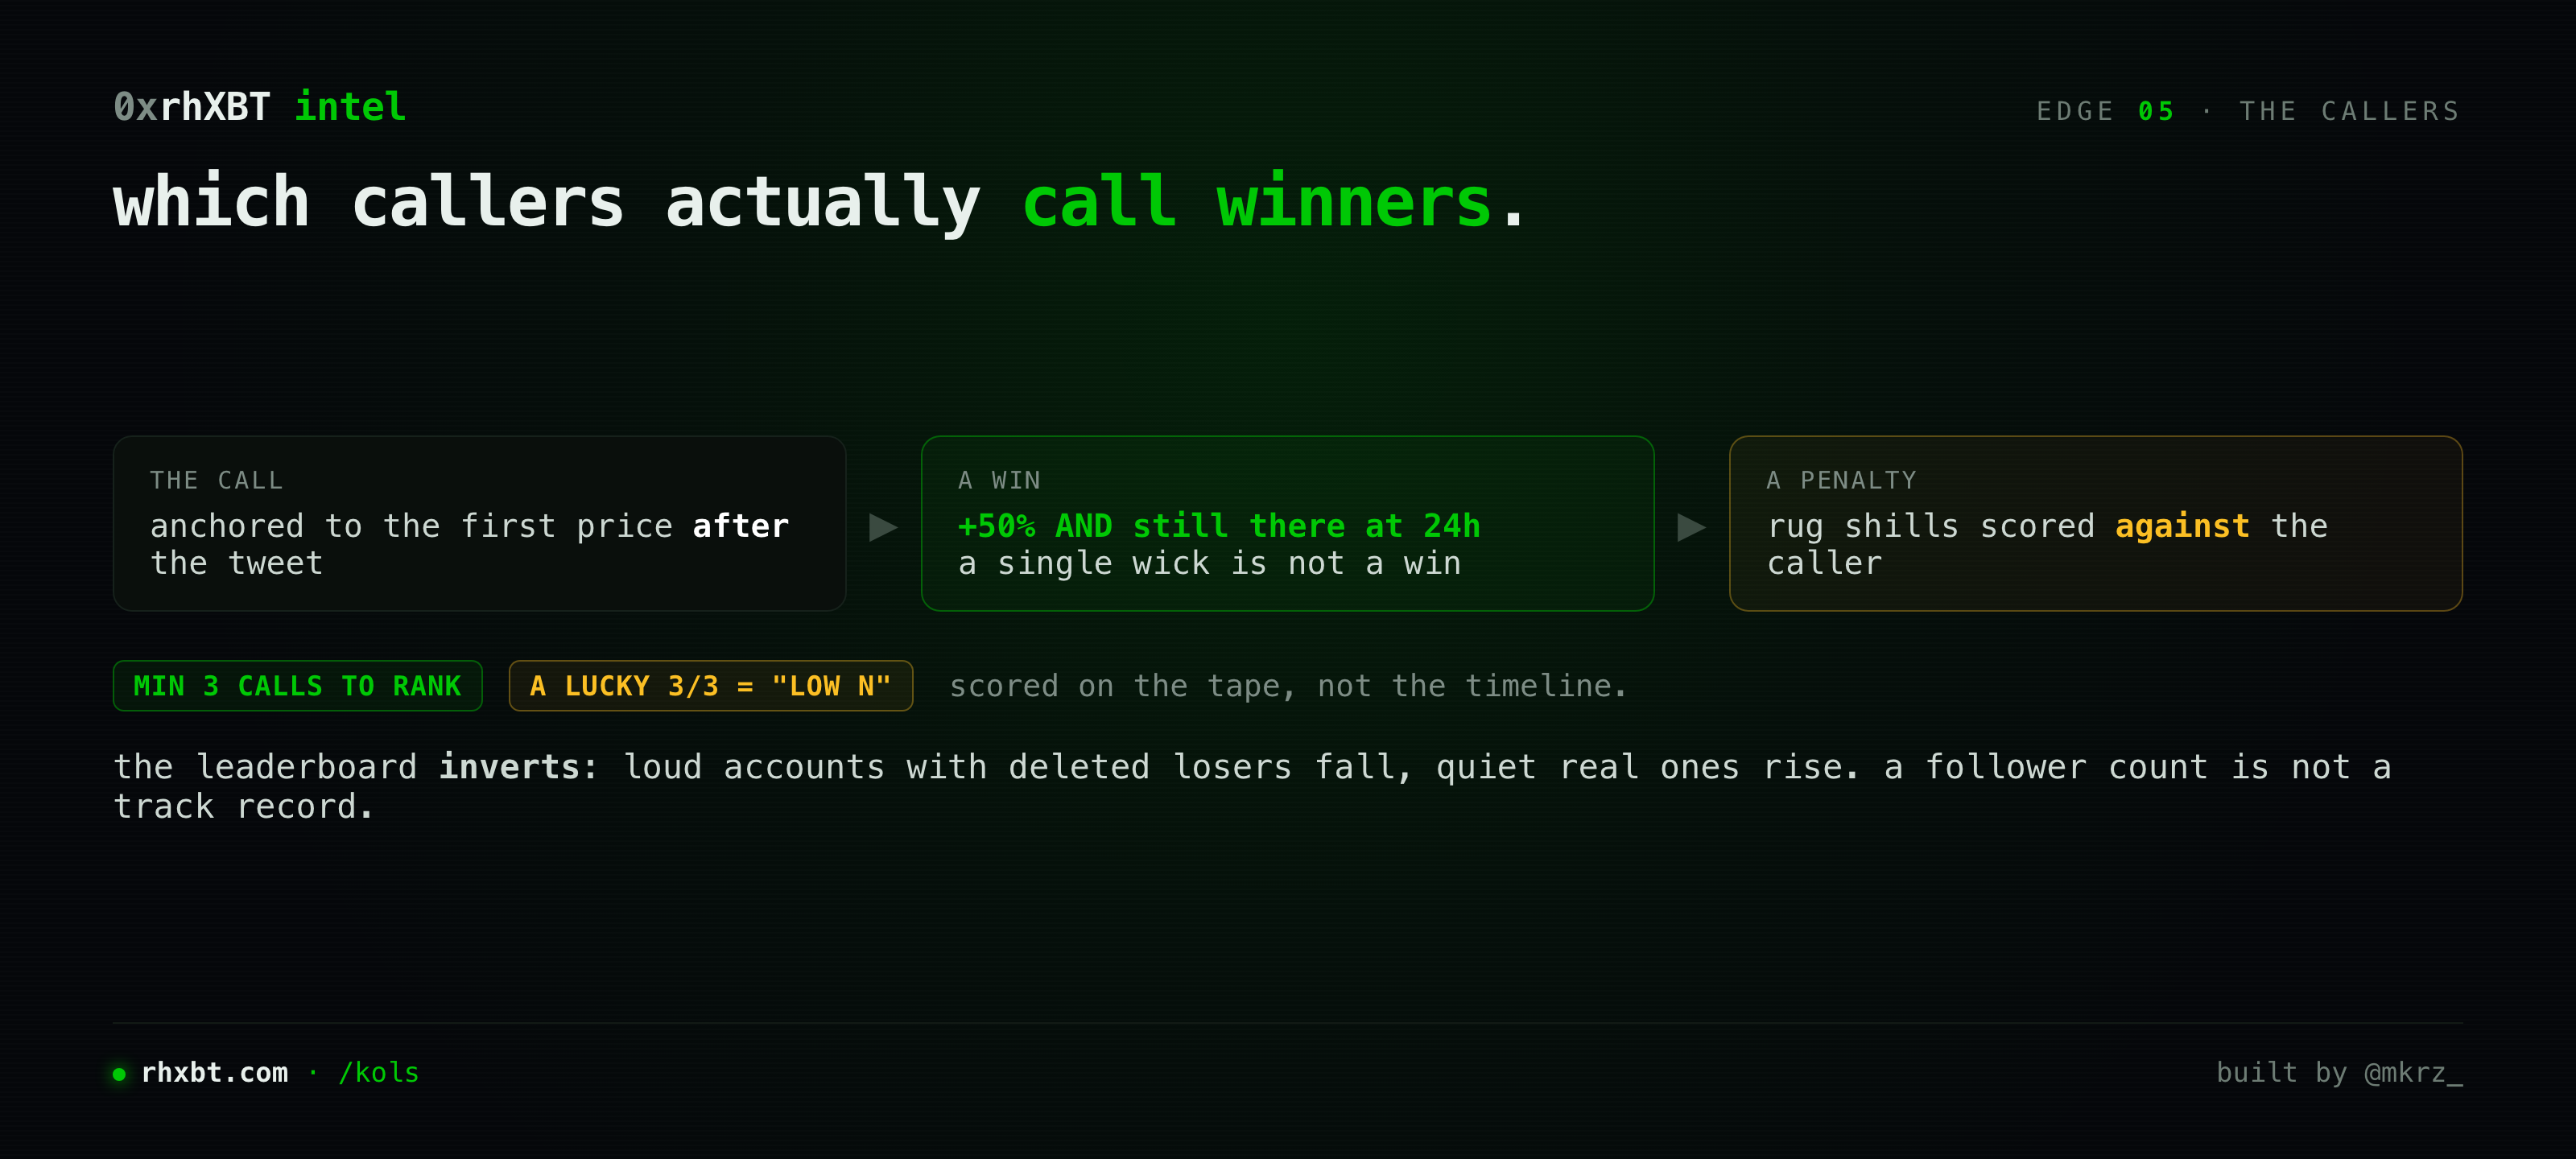
Every timeline is full of "I told you so" screenshots posted after the fact. Onchain, you do not have to take their word for it, because every call can be scored against the tape.
▸ CALLER SCORE   scored on the tape, not the timeline

  entry     anchored to the first price observable AFTER the tweet
  win       +50% AND still there at the 24h mark  (a single wick ≠ a win)
  penalty   rug shills scored against the caller
  gate      min 3 calls to rank · a lucky 3/3 carries a "low n" flag
  result    loud accounts with deleted losers fall. quiet real ones rise.
Do that and the leaderboard inverts. A follower count is not a track record. The tape is.
8The part nobody wants to hear: when the chain lies to you
Here is where most "onchain analytics" quietly fails, and where I will be honest the way these articles should be.
Onchain data is not automatically true. It is automatically recorded. Those are different things, and three traps catch almost everyone.
▸ THREE TRAPS   what an honest indexer REFUSES to print

  DECIMALS   a dust transfer valued at the 18-default → "$636m whale"
             → refused. an unknown decimal is "cannot value", not 18.
  FOSSIL     a drained pool's last trade still has a price, no liq behind it
             → gated off. a price with no liquidity is a fossil, not a quote.
  WASH       turnover 10× liquidity, a wallet trading itself
             → distrusted. that is not demand, it lowers trust, never raises it.

  rule       topology doesn't buy truth. a signal survives only if it passes
             the checks money can't fake: real pooled liq, a fresh price,
             correct decimals — otherwise it doesn't print at all.
Judge the chain on numbers that can lie to you and you will be confidently wrong. This is the part that took the longest to build, and it is the part that makes the rest worth reading.
9Do you even need this?
As these articles should, let me tell you honestly who this is not for.
If you are buying one bluechip and holding for a year, you do not need any of it. The chart is fine. The edge here is for people making decisions where being thirty seconds and one address ahead actually changes the outcome.
Skip the onchain layer when:
- You are holding, not trading. The inputs do not matter if you are not acting on them. - You only touch the biggest, most liquid names. Impersonators and snipers cluster on the small and the new. - You will not check an address before you buy. If you are going to ape the ticker anyway, no tool can save you.
The tell is simple. The moment you touch a new launch, a thin pool, or a ticker you have not seen before, the price is the least safe number on the screen.
10How to read the whole thing in thirty seconds
You do not need to run an indexer. That is the part I already did.
rhxbt.com is the terminal: a trend board that fossil-gates dead tokens, a launch radar with the sniper flags, a KOL leaderboard scored on the tape, the bridge flow, and the stock-premium dashboard that prices every equity token three ways. Every number carries how old it is, and an unknown value renders as unknown, never as a fake zero.
If you live in Telegram, the free bot is faster.
▸ ASK THE BOT   (telegram · free · read-only, never asks for keys)

  you   $VEX
  bot   $VEX · $0.42 · liq ~$685k · 0xA1…9f
        ⚠ 2 other contracts use $VEX — check the address
  you   0x<any contract we haven't indexed yet>
  bot   fetches it on the spot, prices it, then answers.
The whole point is that the hard part, indexing every swap since genesis and refusing to print a number the data cannot justify, is done. You just read the output.
11What this actually means for you
That is the whole picture. You now know why the price is the summary and not the story, the five edges that live underneath it, the exact three ways onchain data lies, and who this is genuinely not for.
The move is not to stare at more charts. It is to look one layer down before you act: check the address, check the liquidity is real and fresh, check who was early, check whether the caller has ever actually called a winner. Every one of those is public. Most people just never open it.
The chart is a crowd reacting to a decision. The chain is the decision. Read the chain, and you stop being the last to know.
If you want the edges as they happen, the terminal is free and the bot is free:
Terminal — https://rhxbt.com Telegram bot — @0xrhXBT_Bot Follow — @mkrz_